Debugging WPF applications can be a tough challenge, especially for people just starting off with the platform. Not only is it tough to debug WPF code, but just figuring out how to build what you dream up can be a challenge. The point of this blog post is to make it easier to find information about how to design WPF applications, and how to debug them efficiently.
Getting info and help
Use Google (duh). I’m amazed at how many questions I see posted around the web asking how to do something in WPF, whose answer is immediately obvious after a simple Google search.Visit Microsoft’s WPF Forum and use the Search page. You might be surprised at how many times your question has been asked and answered there. Be sure to use the Advanced Search Options and filter on the WPF Forum:

If your searches come up empty, you should post your question on the WPF Forum. There are many helpful people who monitor that forum. However, before posting your first question there, be sure to read this post by Rob Relyea about forum etiquette.
The MSDN documentation is your friend. If you want to have a really fast and helpful friend use your local copy of the help files, which was installed during installation of the Windows SDK. If you don’t know what I’m referring to, go Start | All Programs | Microsoft Windows SDK | Windows SDK Documentation.
Read books about WPF. I have found ‘WPF Unleashed’ and ‘Applications = Code + Markup’ to be great.
Read peoples’ WPF blogs. For a great listing of WPF blogs, check out Tim Sneaths’ WPF blog roll here.
Check out all of the great resources on http://wpf.netfx3.com/. That site has a lot of samples, demos, links to reading material, etc. It’s definitely a site to put in your Favorites list.
http://www.NetFxGuide.com is another gem.
CodeProject articles about WPF are, of course, a great resource. You can view a list of all their WPF articles here.
Debugging tips and tricks
Inner Exceptions reveal the answer to so many runtime exceptions that it’s barbarically annoying (yet helpful). I often see questions where folks ask why their WPF app is blowing up, and the answer lies in an InnerException one or two levels deep. In case you have no idea what I’m talking about, allow me to explain. The standard .NET Exception class has a property called InnerException. That property can reference another Exception, whose message might contain an explanation of why the error occurred. The InnerException itself might have a reference to its own InnerException, and so on.
As exceptions are thrown, handled, and re-thrown in the .NET Framework exceptions can be chained together to provide a “history” of the error. Many WPF exceptions have several nested InnerExceptions, each of which might contain a useful piece of evidence you can use while debugging. Usually the deepest (most nested) exception is the one which explains what the real problem is.When you are running an application in debug mode and an exception is thrown, you will first be confronted with Visual Studio’s exception dialog:

After clicking the View Detail link, you can dig into the guts of the exception and check out what actually went wrong:

There is a fantastic free utility, by Pete Blois, called Snoop which you should download if you want to do any serious WPF debugging. Snoop is the best WPF debugging tool out there so far. Get it. Not only will it show you the entire element tree of a WPF user interface, but it will let you see many other things such as: what routed events have been raised, data binding errors, a preview of any element, a zoomed view of an element, and more.
A while back Mike Hillberg blogged about the TraceSources built into WPF. I’ve used this for debugging and educational purposes, and found it to be useful for both. As he mentions, the data binding source is “on” by default, as you can see when viewing the Output window in Visual Studio while debugging a WPF app.
As always, get Lutz Roeder’s Reflector. That is the best .NET utility application of all time. It will decompile any .NET assembly (including the WPF assemblies) and allow you to read how they work, in the high-level language of your choice. If you don’t already have it, what’s wrong with you? 🙂 Also, there is a BAML-to-XAML converter add-in for Reflector you can use to inspect the resources a WPF assembly has embedded in it.
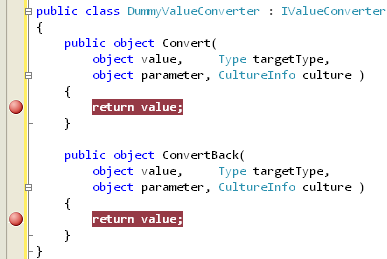
Create a dummy value converter and use it, often. If you ever want to know what value a Binding is passing from one object to another, inject your dummy value converter into it and set a breakpoint. I’ve used this little trick a million times and it never fails to help. Here’s the basic gist:
Another useful trick for debugging is to use the DependencyPropertyHelper’s GetValueSource static method. It takes in a DependencyObject and a DependencyProperty, and returns a value indicating what actually set that property (with regards to the rules of precedence associated with DPs).
If you have any other useful tips that belong in this blog post, feel free to leave me a comment with your ideas.


I generally use Lester’s XamlPadX (http://blogs.msdn.com/llobo/archive/2006/10/31/XamlPad-Xtended-_2800_with-an-interpreter_2900_.aspx)
It has a toolbar button for looking at the default ControlTemplates. I find it very useful when creating ControlTemplates. I tend to copy+paste from there 🙂
Pavan,
Great tip! XamlPadX is very useful indeed. 🙂
Thanks,
Josh
This is a very useful post, I’m new to all this blogging stuff but tips like these are helping me on my way. Thanks very much
Ityped debug wpf into google and found your article at number one. As a newbie, I’m still a bit lost, but I’ll follow all the links on your article and take my time trying to digest it and hopefully get there in the end. Thanks for this.
Sometimes the break-point just don’t get hit.
It’s just on my applications ?
What can the be the cause for that kind of behavior ?
And how they sometime like magic get fixed ?
[…] way for debugging data binding is to use a converter and set a breakpoint in the Convert method. This can be cumbersome to work with since you have to create a dummy […]
What if the RTM version of VS2008 locks up when you try opening ANY xaml file? I tried first to look at code for Podder, and after trying twice, tried starting new WPF project in VS2008 and same thing happens when it tries opening form it adds to the project.
Mike,
I dunno. Never had that problem. If re-installing VS2008 does not do the trick, perhaps a swift roundhouse kick will clear things up. 😀
Josh
[…] Josh Smith wrote a very interesting article where he gives some tips on debugging databinding and also on how to dig into exceptions that are […]
what do you do when you dont see the view detail link when the exception is thrown ?
Do u have any example of ListView containing ComboBox in it ?
Also tell me how to bind the comboBox of ListView
Currently I am using CollectionViewSource to bind the ComboBox of ListView
but in edit mode what i am save previousely data not showing in combobox
ListView.ItemContainerGenerator.ContainerFromItem(obj) as ListView return me a null
Value
[…] Советы по отладке и изучению WPF […]
[…] Советы по отладке и изучению WPF […]